Type scale graphs
By Trys Mudford
Communicating the power and simplicity of fluid typographic scales to Utopia newcomers continues to be a focus for us.
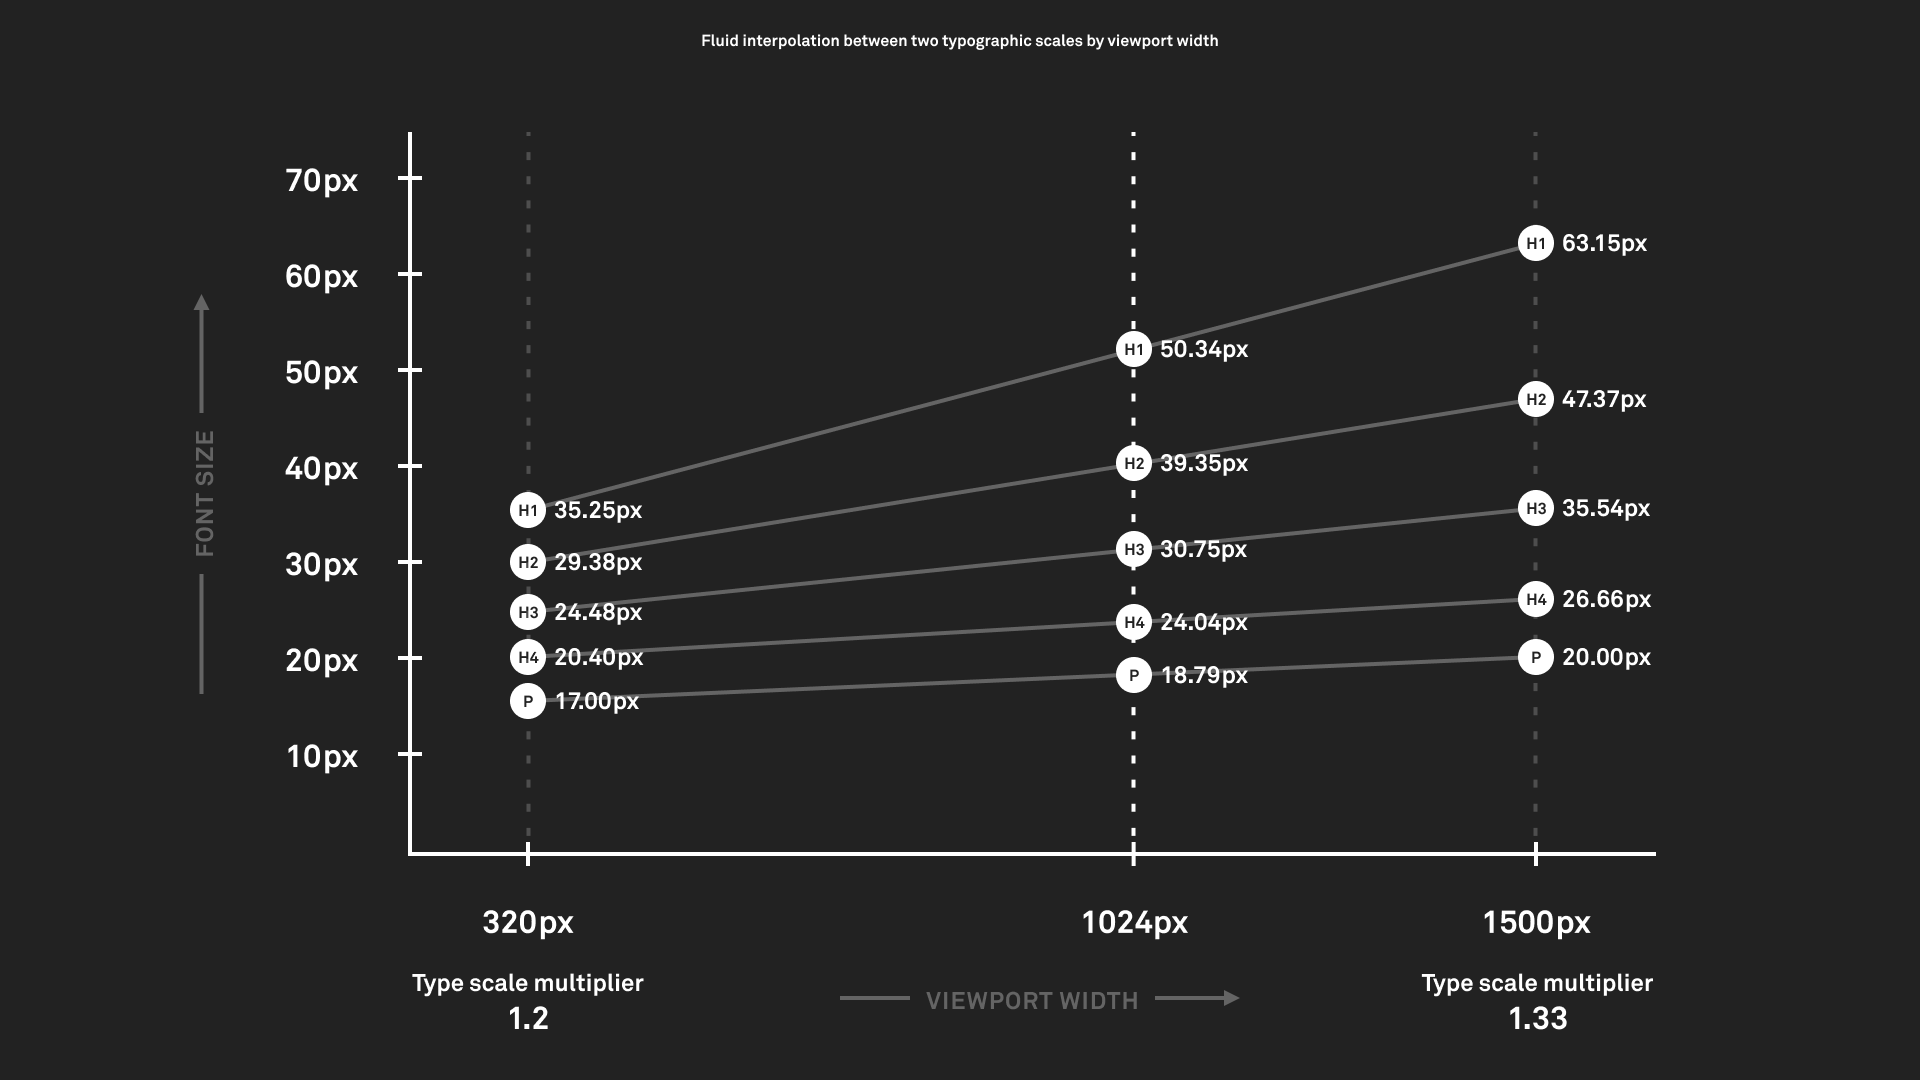
The concepts of fluid modular scales and their systematic benefits can be tricky to articulate. When we first began sharing the concepts of Utopia – long before this website existed – there was one image that reliably got the penny to drop:

This graph has gone through a few iterations over the years, and has continued to be a useful deck slide when introducing colleagues and clients to fluid responsive design. For the latest iteration, we’d like to share a small – but hopefully powerful – new feature on our type scale calculator. Your type scale can be viewed in the original font size table, the scale visualiser, and now, the graph view:

The graph plots the font size of step 0, and a few surrounding steps, to help visualise the relationship between your two type scales at your min and max viewports. Rather than plot every step, which could get cramped, we’ve opted to focus on the key steps around the origin. If this doesn’t meet your use-case, we’d love to hear from you.
First published on 26 November 2024